


Shared living environment and lifestyle associate with simultaneous allergic traits in dog-owner pairs
Of dog owners, 31% were sensitized to aeroallergens (mean sum of specific IgEs = 15.30 kU/l, range = [1.02, 78.94]). Interestingly, ca. 10% of owners were sensitized to dog, (i.e., specific IgEdog > 0.35 kU/l), while none of the dogs were sensitized to humans. Aeroallergen sensitization in humans was significantly associated with self-reported symptoms of asthma (Fisher’s exact test, p = 0.04), eczema (p = 0.02), atopic dermatitis (p = 0.04), and wheeze (p = 0.003), while rhinitis showed borderline association (p = 0.07).
About 20% of dogs suffered from owner-reported allergic symptoms. In contrast to humans, IgE values were not a robust measurement of allergy, as sensitization was not associated with the severity of owner-reported symptoms (correlation = 0.06, p = 0.46).
Based on logistic regression, dogs living in urban areas were more likely to suffer from owner-reported allergic symptoms than rural dogs (p = 0.003) while similar but borderline association was discovered for humans (p = 0.054; Fig. 1a). As a sensitivity analysis, we excluded owners who reported they have allergic skin symptoms and tested association between dog allergy and living environment (p = 0.042), which suggest that the judgement of symptomatic owners did not confound our results. Similarly, urban-type lifestyle increased the risk of allergy in dogs (p = 0.007) while in humans association was not statistically significant (p = 0.093; Fig. 1c).
The association between living environment and lifestyle with allergic traits in dogs and humans. In dogs, both (a) living environment and (c) lifestyle associate with the prevalence of owner-reported allergic symptoms (logistic regression, p = 0.003 and p = 0.007, respectively) while in humans living environment and lifestyle showed borderline association with aeroallergen sensitization (p = 0.054 and p = 0.093, respectively). (b) Shows adjusted odds ratios from logistic regression separately for dogs and humans. Each explanatory variable is adjusted for other variables mentioned in the figure, separately for dogs and humans. Bars indicate the confidence intervals. Dashed bars indicate insignificant association between exposure and outcome in adjusted analysis. Breed: LR = breed of dog is Labrador’s Retriever, Sex: Male = Individual is male, Mother dog: A = dog’s mother is allergic, Environment: U = living environment of individual is urban, Owner: A = owner of a dog is sensitized, Age: Under 40 = human is younger than 40 years, and Pet dog: A = pet dog suffers from owner-reported allergy symptoms.
In accordance to previous research6, dogs and their owners tended to be allergic or healthy concurrently. In other words, an allergic dog was more likely to have a sensitized owner than a healthy dog (logistic regression, p = 0.002). The same was true for humans (p = 0.002), a sensitized owner was more likely to have an allergic than a healthy dog. This pattern did not change after exclusion of owners sensitized to dogs. After adjustments for age, sex, and living environment this association remained significant for humans (Fig. 1b, p = 0.009). Age and sex also associated with the risk of aeroallergen sensitization in humans (p = 0.004 and p = 0.015, respectively).
After adjustments for breed, sex, allergy of mother dog, and living environment, having an sensitized owner showed only a trend for dogs (p = 0.11). In dogs, being a Labrador retriever (instead of Finnish Lapphund), having an allergic mother dog, and living in an urban environment significantly increased the risk of allergy in the adjusted analysis (p = 0.042, p < 0.001, p = 0.013, respectively; Fig. 1b). However, large confidence intervals, arising from the small number of allergic dogs, warrants cautiousness to these results.
We also divided dog-owner pairs into three groups: allergic, healthy and mixed dog-owner pairs (Fig. 2a). Mixed pairs included both healthy and allergic individual. These dog-owner groups associated with living environment and lifestyle; allergic dog-owner pairs were more likely to live in an urban environment and have urban-type lifestyle than healthy pairs (ANOVA, p = 0.010 and p = 0.028, respectively; Fig. 2c,d) while exercise environment did not show association (Fig. 2b).
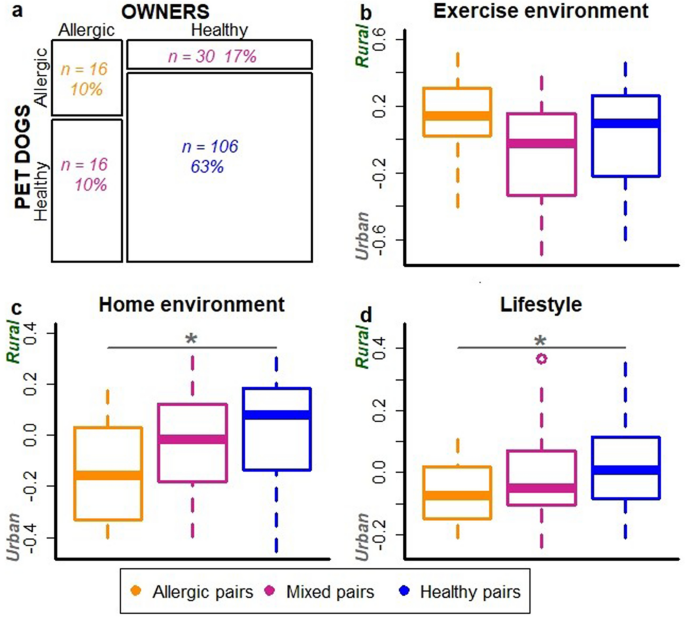
Dogs and their owners tend to be allergic or healthy concurrently. The proportion of allergic, healthy and mixed i.e. mixed dog-owner pairs in the data (a). The association of exercise environment (b), living environment (c) and lifestyle (d) with dog-owner groups. Decreasing values on y-axis indicate higher urbanization of exercise and living environment as well as more urban lifestyle. Living environment was significantly more urbanized in allergic than healthy dog owner pairs (ANOVA, p = 0.010). Additionally, lifestyle was more urban in allergic compared to healthy dog-owner pairs (p = 0.028).
Dogs and their owners have partially shared microbiota on skin but not in gut
By analyzing skin and fecal samples from dog-owner pairs, we identified 52,589 operational taxonomic units (OTUs) from 43 million bacterial 16S rRNA gene sequences. Microbiotas tended to cluster primarily according to a body site, and secondarily according to species (Principal Coordinate Analysis, PCoA; Fig. 3a). The dog and human gut microbiotas were clearly separated, while the skin microbiotas of dogs and humans clustered closer to each other (Fig. 3a). Fusobacteria were highly abundant in the dog gut but largely absent in the human gut. Proteobacteria were more abundant on the dog skin than on the human skin, and rare phyla contributed more to dog than human skin microbiota (Fig. S1).
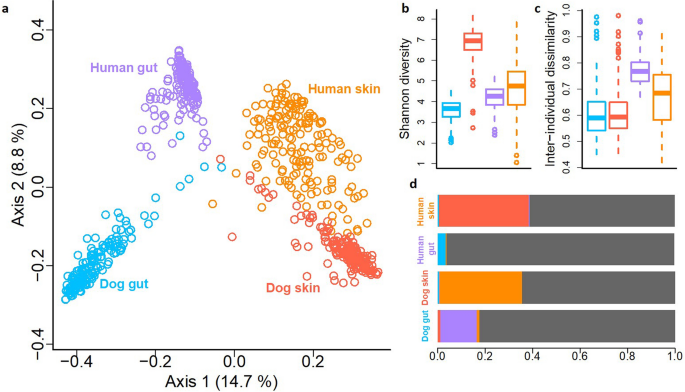
An overview of skin and gut microbiota differences between pet dogs and humans. The Principal coordinate analysis (a) shows separation between skin and gut microbiotas as well as between dogs and humans. Dog skin has clearly the highest Shannon diversity in comparison to other studied microbiotas (b). The inter-individual variation is higher between humans than dogs (c). The Bayesian source tracking analysis between studied microbiotas shows that skin microbiota of dogs and humans can originate from each other while gut microbiotas, especially in humans, are mostly independent (i.e. the proportion of unknown source, grey, was large) (d).
We studied associations between microbiotas utilizing Bayesian source tracking27. In agreement with previous analyses, the skin microbiota of human and dog were partly related to each other while gut microbiotas were largely independent (Fig. 3d). Indeed, the skin microbiota of dog-owner pairs resembled each other more than random dog–human pairs (ANOVA, p < 0.001, Fig. S2), while such an association was not found with the gut microbiota. Moreover, a larger proportion of OTUs were universally present in all studied skin samples (30 OTUs were present in 90% of all samples) than in all gut samples (9 OTUs were present in more than 60% of samples). For example, Propionibacterium was present in all but one skin sample.
The mean number of OTUs was clearly higher on the skin than in the gut in both dogs and humans (Table S4; p = 2.2e−16). Accordingly, the number of phyla, classes and families as well as proportion of unknown taxa were larger on the skin than in the gut of both hosts (Table S5). Among all habitats, the dog skin showed the highest richness (Table S4) and Shannon diversity (Fig. 3b; ANOVA, p < 0.0001 in each comparison). Interestingly, even though the dog skin was the most diverse habitat, the skin microbiota within dogs differed less between individuals than within humans (Fig. 3c; p = 1.53e−07), and this was also true for the gut microbiota (p < 2e−16).
Structure of skin microbiota is associated with lifestyle and living environment in both species
Both living environment and lifestyle were more significantly associated with the skin than with the gut microbiota. Structure of skin microbiota differed between dogs and humans, rural and urban living environments and rural and urban lifestyle, while structure of gut microbiota differed only between dogs and humans. (PERMANOVA, Table S6).
Random Forest Regression (RFR) predicted twice as much variation in the living environment from dog skin compared to human skin microbiota (24.27% vs. 11.57% of out-of-bag (OOB) error variation, respectively). Only a small proportion could be predicted from the dog and human gut microbiotas (3.82% vs. 2.22% of OOB variation, respectively). Further, lifestyle was as predictable both from the dog and human skin microbiota (17.71% vs. 17.33% of OOB variation, respectively), while only the dog gut microbiota predicted lifestyle (15.66% vs. 1% of OOB variation).
Previously, we have reported homogenization of skin microbiota in urban dogs7. Also in dog owners, the skin microbiota was homogenized in urban environment and in response to urban lifestyle (Fig. S3a, p = 0.002, and Fig. S4a, p = 0.02, respectively). Interestingly, the opposite was true for their gut microbiota (Fig. S3b, p = 0.01).
We investigated whether the living environment and lifestyle are associated with the proportion of shared OTUs between dogs and humans. According to Source Tracking analysis, lifestyle seemed to explain the sharing of microbes, while living environment did not show associations. The urban lifestyle increased the proportion of human skin bacteria in the dog skin microbiota (p = 0.044; Fig. S5a). Moreover, rural lifestyle increased the proportion of the dog gut bacteria in the human gut microbiota (p = 0.028; Fig. S5b) as well as the proportion of human gut bacteria in the dog gut microbiota (p = 0.009; Fig. S5b).
Modest similarities in the environment and lifestyle related microbiota in allergic dogs and sensitized humans
We have previously discovered that skin microbiota is clustered by living environment and lifestyle in pet dogs, and that these factors are also associated with the risk of allergy7. Here, we observed corresponding clustering of skin microbiota in dog owners (Fig. 4a) as well as increasing prevalence of aeroallergen sensitization with the urbanization of living environment and lifestyle (Fig. 4c).
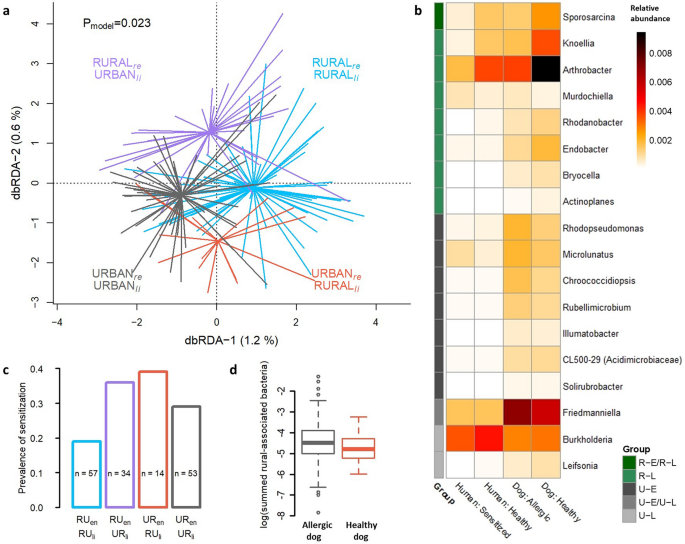
The living environment and lifestyle related skin microbiota in allergic and healthy individuals. Living environment (rural/urban) and lifestyle (rural-type/urban-type) constrained the skin microbiota of dog owners (a) in Distance-Based Redundancy Analysis. The prevalence of aeroallergen sensitization in humans showed association with the type of lifestyle and living environment (c) as extremes (rural environment + rural lifestyle vs. urban environment + urban lifestyle) were significantly different (ANOVA, p = 0.022). Bacterial genera in skin that significantly differed between rural and urban environments as well as between rural and urban lifestyles, defined with Zero-inflated Log-Normal mixture model, are presented as a heatmap of relative abundancies (b). Some of these taxa differ between species as well as between allergic and healthy individuals. RUen = Rural living environment, RUli = Rural lifestyle, URen = Urban living environment, URli = Urban lifestyle, re = residential environment, li = lifestyle, R-E/R-L = Bacteria associated with rural environment and rural lifestyle, R-L = Rural lifestyle associated bacteria, U-E = Urban environment associated bacteria, U-E/U-L = Urban environment and urban lifestyle associated bacteria, and U-L = Urban lifestyle associated bacteria. The log-transformed, summed relative abundance of rural-associated bacterial genera presented in heatmap were marginally lower in allergic than healthy dogs (p = 0.059; d).
We searched genera that were dissimilarly abundant between allergic and healthy individuals as well as between rural and urban living environment or lifestyle. We did not find differentially abundant genera between healthy and allergic individuals. However, we found genera differentially abundant between rural and urban living environment and lifestyle, some of which further showed differing relative abundances between healthy and allergic individuals (Fig. 4b). The summed relative abundance of all rural-associated genera found in the analysis (Fig. 4b) were lower in the allergic than in the healthy dogs, but association was borderline (ANOVA, p = 0.059; Fig. 4d). Key taxa associated with allergic traits were distinct between species. Urban-environment associated Rhodopseudomonas was enriched in allergic dogs (p = 0.007) and rural-lifestyle associated Actinoplanes was enriched in healthy dogs (p = 0.02). Artrobacter, which associated with rural lifestyle in our data (and with farming in a previous study9), was more common in healthy than allergic dogs, but this associations were of borderline significance (ANOVA, p = 0.069). Sprorosarcina, that was associated with rural environment and lifestyle, was more common in healthy than in sensitized humans (p = 0.034; Fig. 4b).
We also studied weather the sharing of microbes between dogs and owners relate to allergic traits, based on Bayesian Source Tracking analysis. These analyses produced interesting, but mostly non-significant findings probably due to insufficient sample size. For example, increasing proportion of dog skin related bacteria on human skin showed trend towards decreasing prevalence of aeroallergen sensitization (Logistic regression, p = 0.104, Figs. S6a and S7a). On the other hand, allergic dogs tended to have a higher proportion of the human skin related bacteria than healthy dogs (p = 0.13, Figs. S6b and S7a). Interestingly, even though the median proportion of microbes relating to human skin was very low in the human gut (0.37%), it was significantly higher in allergic (0.43%) than in healthy (0.36%) humans (p = 0.003, Fig. S7b).